Capital’s energy
Summary of Capital-energy substitution in manufacturing for 7 OECD countries:
learning about potential effects of climate policy and peak oil
on Energy Efficiency.

Foto| Stefan Andronache
Dona a chi ami ali per volare,
radici per tornare e motivi per rimanere.
Dalai Lama
For nearly 130 years economists have imagined to represent the production of goods and services with a function like, Y = f (x1, x2, …, xn) relating inputs xi, with output Y. Such representation of the production process is severely limited because of the very simple nature of the function: only two inputs have meant a lot of stiffness and little realism. But math was needed to put clarity in the debates, as Wicksteed wrote in 1894:
I use the mathematical form of statement, then, in the first instance, as a safeguard against unconscious assumptions, and as a reagent that will precipitate the assumptions held in solution in the verbiage of our ordinary disquisitions.
Chart 1 – The production function in the economic process

In 1927, the economist Paul Douglas asked the mathematician Charles Cobb to develop an equation describing the time series of U.S. manufacturing output, labour and capital input he had assembled for the period 1889–1922. It was a success: empirically the simulated production “followed” historical data. A function with only two inputs (K, L) “mixed” at will….the idea instilled optimism.
In this line of thought the coal extracted, the assembled refrigerators, GDP using man-hours (L) and a variable representing diggers, machinery, or the aggregate capital (K) explains production. Policies could be made…
Among the main theoretical problems of production economics is the elasticity, a convenient measure quantifying the reactions between input and output. Elasticity is a pure number given by the ratio between two modifications : η = (Δy / Δx) • (x / y) answering the question “how much y varies if x varies by 1%?” For example, if we increase fuels taxes how the gallons purchased by motorists change? If the quantity does not decrease when price increases the demand is said inelastic.
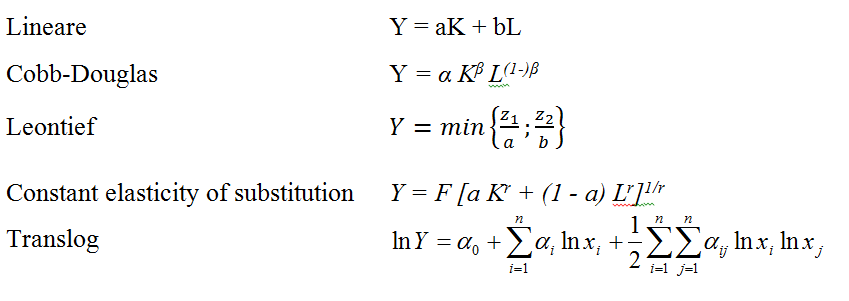
Elasticities may calculated with prices and/or quantities, with quatities input and output or between inputs. In the latter case we speak of the elasticity of substitution (σ). σ measures the variation in quantity of input i (xi) when the price input j (pxj) rises by 1% to maintain output Y constant. All the above mentioned functions, excluding the translog, have fixed elasticity of substitution. 1 the Cobb-Douglas, 0 the Leontief and the infinite linear, constant the CES; these are unrealistic conditions.
Since the ’70s new, more complex and flexible production functions, solved the rigidities in elasticity of substitution between inputs, allowing an increase in inputs number.
Table 1 – Main production functions
Energy and materials entered into the production function, even if:
When Solow and Stiglitz sought to make the production function blackberries realistic by adding in natural resources, they did it in a manner that economist Georgescu-Roegen Criticized as a “conjuring trick” that failed to address the laws of thermodynamics, since their variant aAllows capital and labor to be infinitely substituted for natural resources. Neither Solow nor Stiglitz addressed his criticism, despite an invitation to do so in the September 1997 issue of the journal Ecological Economics (Wiki.)
Historically, the replacement of inputs has been a source of great disagreement between the neoclassical school of economists and ecologists: while the former believe in the substitution, the latter, albeit to varying degrees, favor a complementarity. The issue is crucial. According to the neoclassical theory of production, the economy’s dependence on non-renewable sources can be resolved in only two ways: substitution between input and with technological progress. The first, in fact represented by σ, quantifies the flexibility of an economic system to produce a given output with different combinations of inputs; technological progress is “search” by introducing more or less complicated variables designed to capture the efficiency of inputs, a sort of “parsimony” in the use of energy and materials, but also of capital and labor.
After the first oil shock, important developments have involved both theoretical and applied econometrics, time series of inputs, up to the new formula for the elasticity, aimed at assessing the possibility of changing the composition of K, L, I, M. Different formulations of the Elasticity of substitution (Allen, Cross-price, Morishima etc.) appear in hundreds of scientific articles to quantify the flexibility in the use of inputs in different industries and in a host of countries. The basic question remains: the inputs can be changed at will or there are rigidities? (I would add, regardless of trade unions, Jobs Act, etc.)
Unfortunately for the unions (and many others), many empirical studies found it possible to replace men with machines. But unfortunately for the industry and the financial sector, it was also found that substitution between capital and energy is difficult. Energy is necessary – when not complementary – to capital: if the energy price increases, the amount of capital decreases and if the amount of capital decreases, so falls GDP. So often it happens and this is happening since 2008. It seems trivial, but it’s not just the economy that needs energy, but more precisely, the capital. The interested reader might check Energy intensity article.
In any case, the economic process, according to models and their assumptions of economic theory developed by neoclassical economists ( “liberal” we would say today), can not help but cheap energy is an explicit and just (re) known admission of rigidity and fragility of the economic system: it takes plenty of energy to do (and operate) machines.
At this point we should remember that despite the economic science admits its limitations in accurately representing the economic process, in practice often, when the empirical results “talk” (unless rapid rebuttal) then the economic results permeate deep into politics (what we call “the influence of the technicals”), thus influencing the international strategy choices. In a conservative way.
Just think of the role the concept of “productivity”, which today involves the general belief of the need to obtain a total wage flexibility, plays today.
Taking up a bit of history is important – I think – to remember (and recognize) the merits of the development of production function in “free functional forms” by two agricultural economists, Earl Heady and John Dillon, whose research on new functions to represent the agricultural production and livestock, based on Taylor series developments included either the Translog that the Generalized Linear respectively so named by Christensen, Jorgenson and Lau and Diewert more than ten years after (note 2.)
In order to verify the state of σ I used the EU-KLEMS data, estimated a translog function for France, Germany, Italy, Japan, UK and USA on the 1970-2005 period for the manufacturing sector. The results show an overall complementarity between E and K, as shown in Chart 1. Negative elasticity of substitution means complementarity between production factors.
Chart 1 – Capital Energy Elasticity of substituton in 6 countries (1970-2005)
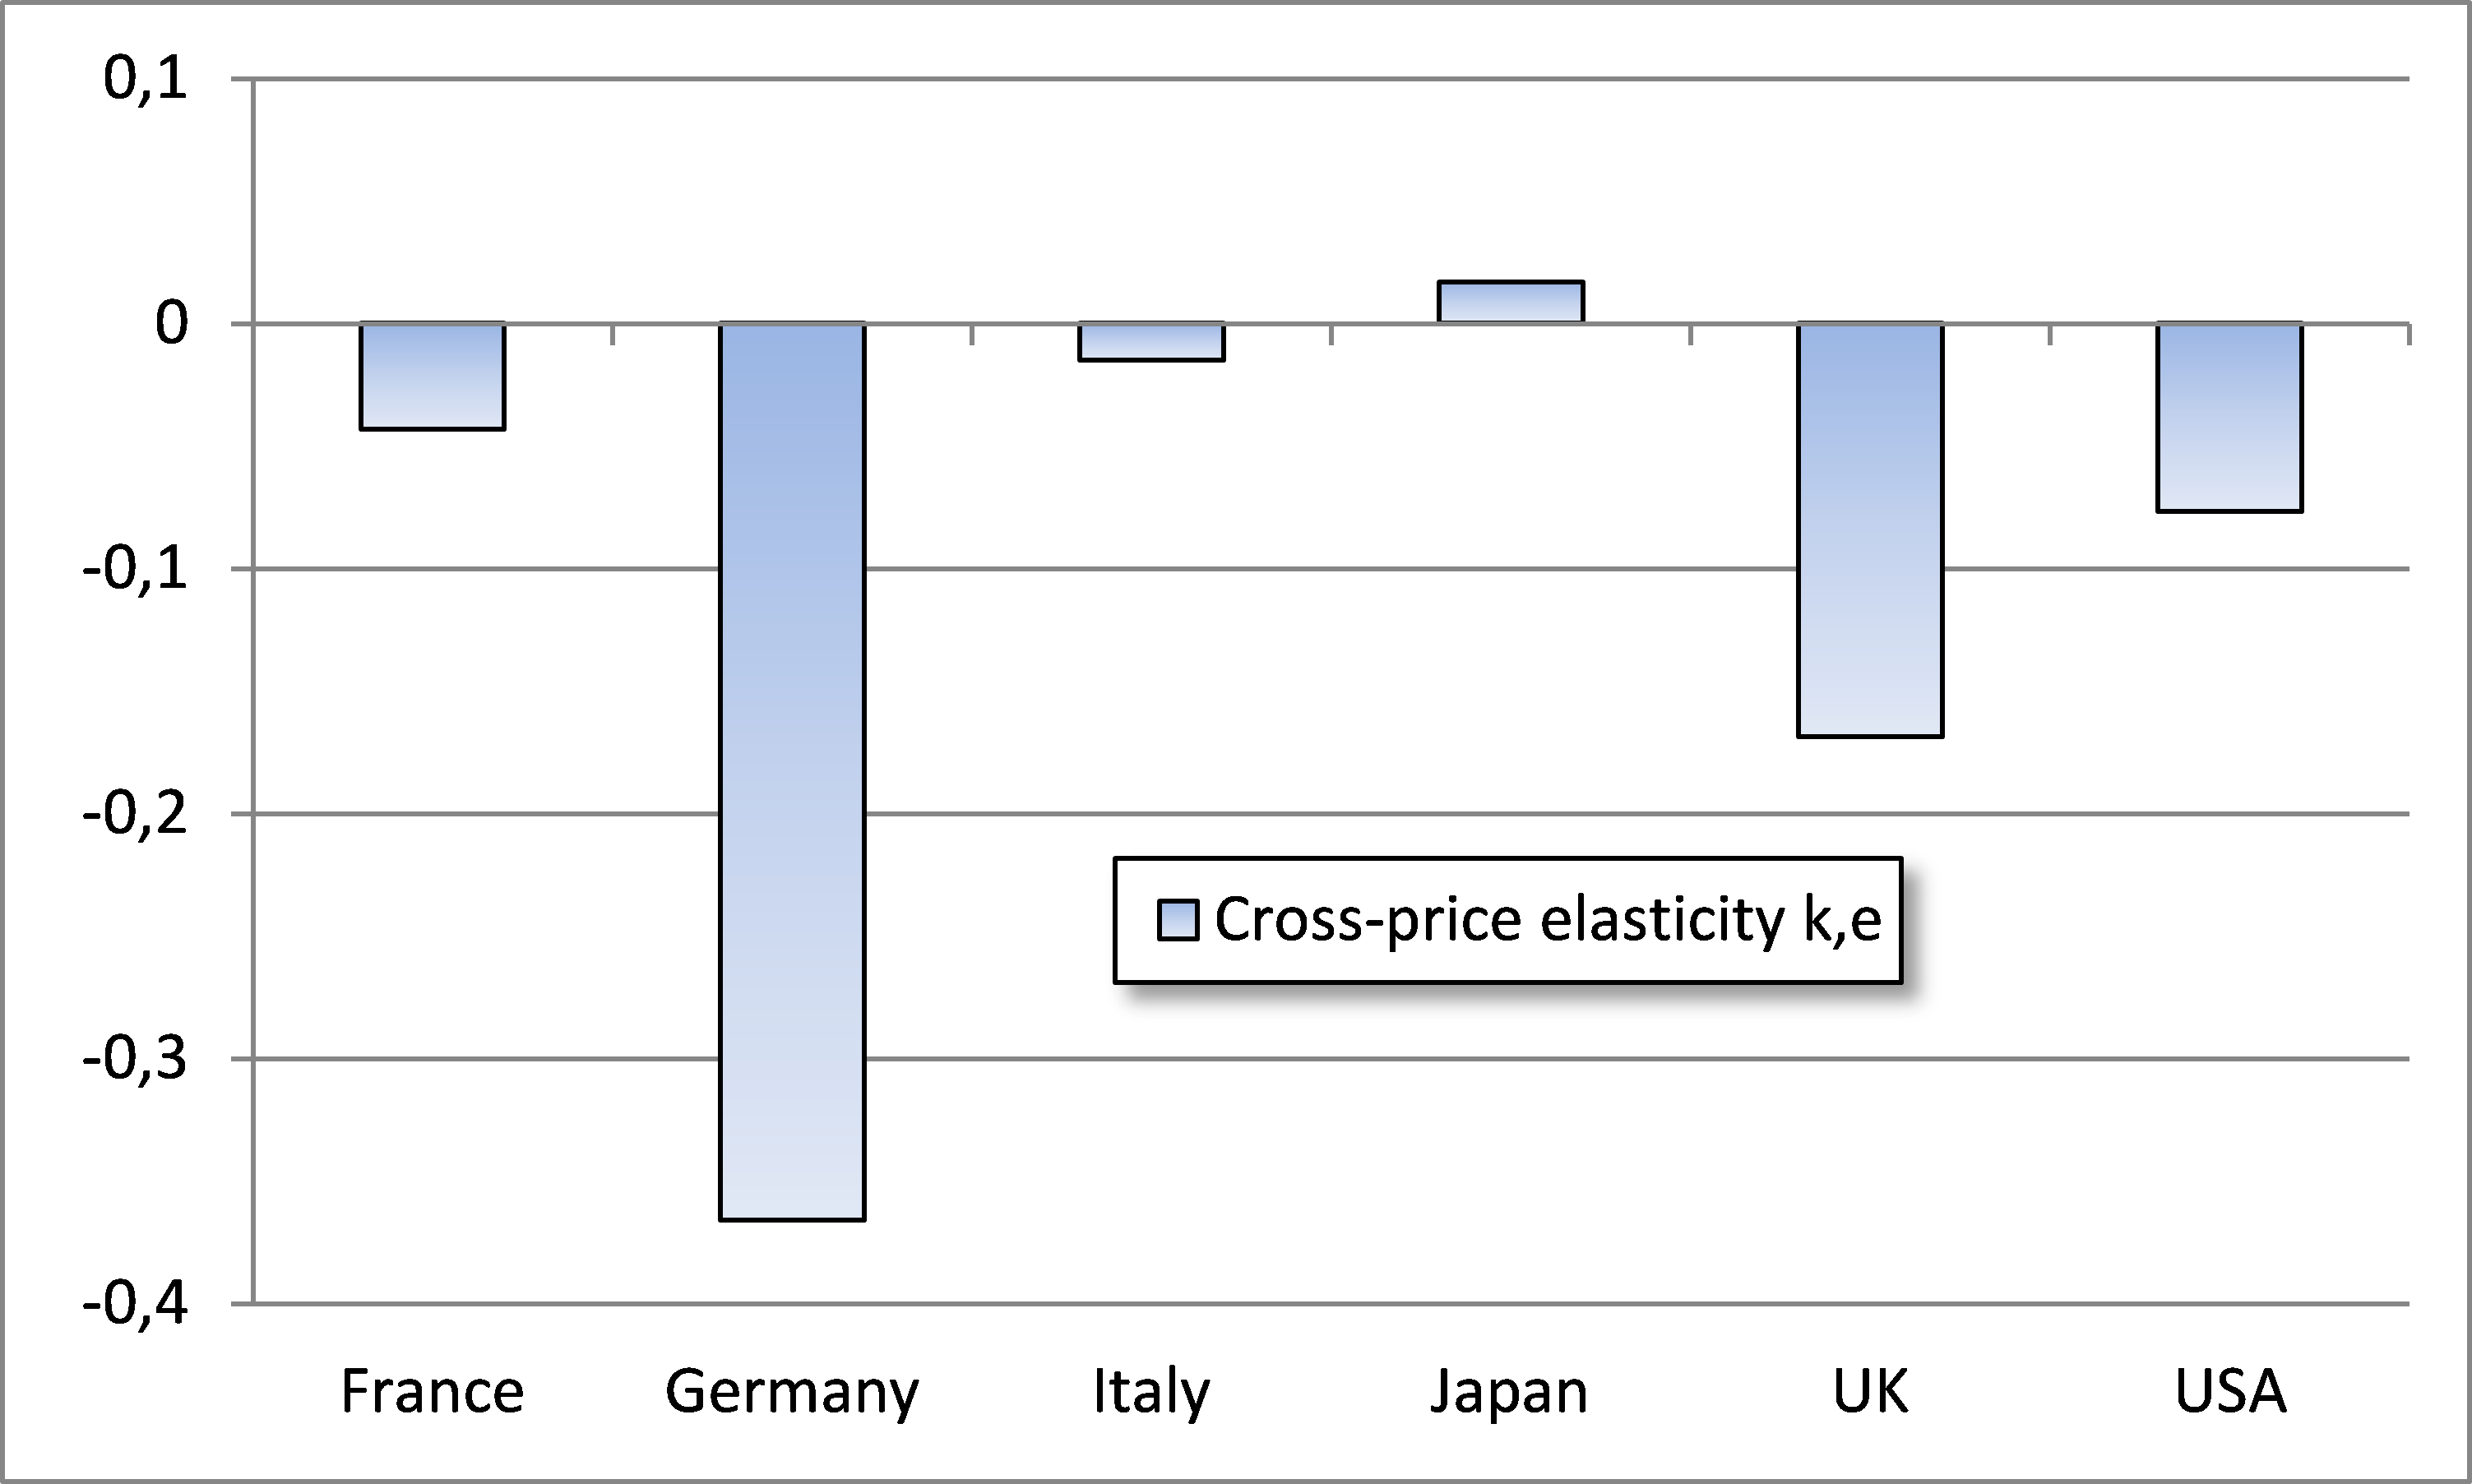
The results are all the more alarming since the EU-KLEMS data stop in 2005, before the oil leap of 2008, which was followed by a global economic crisis that is still ongoing: an empirical test of the “need” to cheap energy of ‘ current economic system. An economic system that seems to dematerialize, become agile, clean, light and – in short – sustainable, but, looking at production in the strict sense, no energy “stops” a bit ‘like our cars.
It is the revenge of the heretic economist Georgescu-Roegen, the pessimist, the malthusian who insisted on the role played by thermodynamics in shaping the economic process. In this rationale we see the inefficiencies of internal combustion engines, the rubber tires on a rough asphalt to move people and how things have a cost (less and less) hidden that the EROEI teaches us to account (see Luca Pardi Il punto di rottura).
Chart 2 – Production with complementary inputs
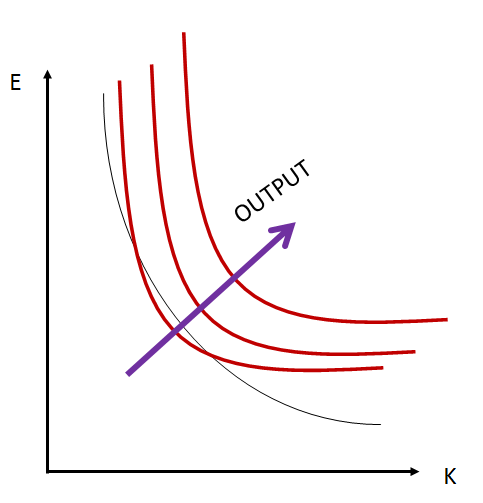
When economics developed a production model that could include energy and materials it found they were needed. It is a confirmation, I think an important one, of the need to change our economies’ production structure, toward discouraging energy-intensive products and investing in rail and bicycle infrastructure. It involves taxing carbon and redirecting agriculture towards production of proximity, organic and seasonal.
The alternative is simply none, or, rather, is represented by the growth (and collapse) of debt that, however, prevents growth and – more important the well-being of people, as well explains Gail Tverberg.
1 For the story of the early production function see Humphrey.
2 See Heady E. e Dillon, J. Agricultural Production Functions, Iowa University Press, 1962 e Modeling and measuring natural resource substitution, Edited by Ernst R. Berndt and Barry C. Field, MIT Press, 1980.
Wicksteed, P. H. (1894). An essay on the co-ordination of the laws of distribution. London: Macmillan & Co.
Original in Italian http://ugobardi.blogspot.it/2015/10/lenergia-del-capitale.html

